- TOP
- Investor Relations
- Business Performance/Finance
- Financial Highlights
 Business Performance/Finance
Financial Highlights(Consolidated)
| 2019 | 2020 | 2021 | 2022 | 2023 | |
|---|---|---|---|---|---|
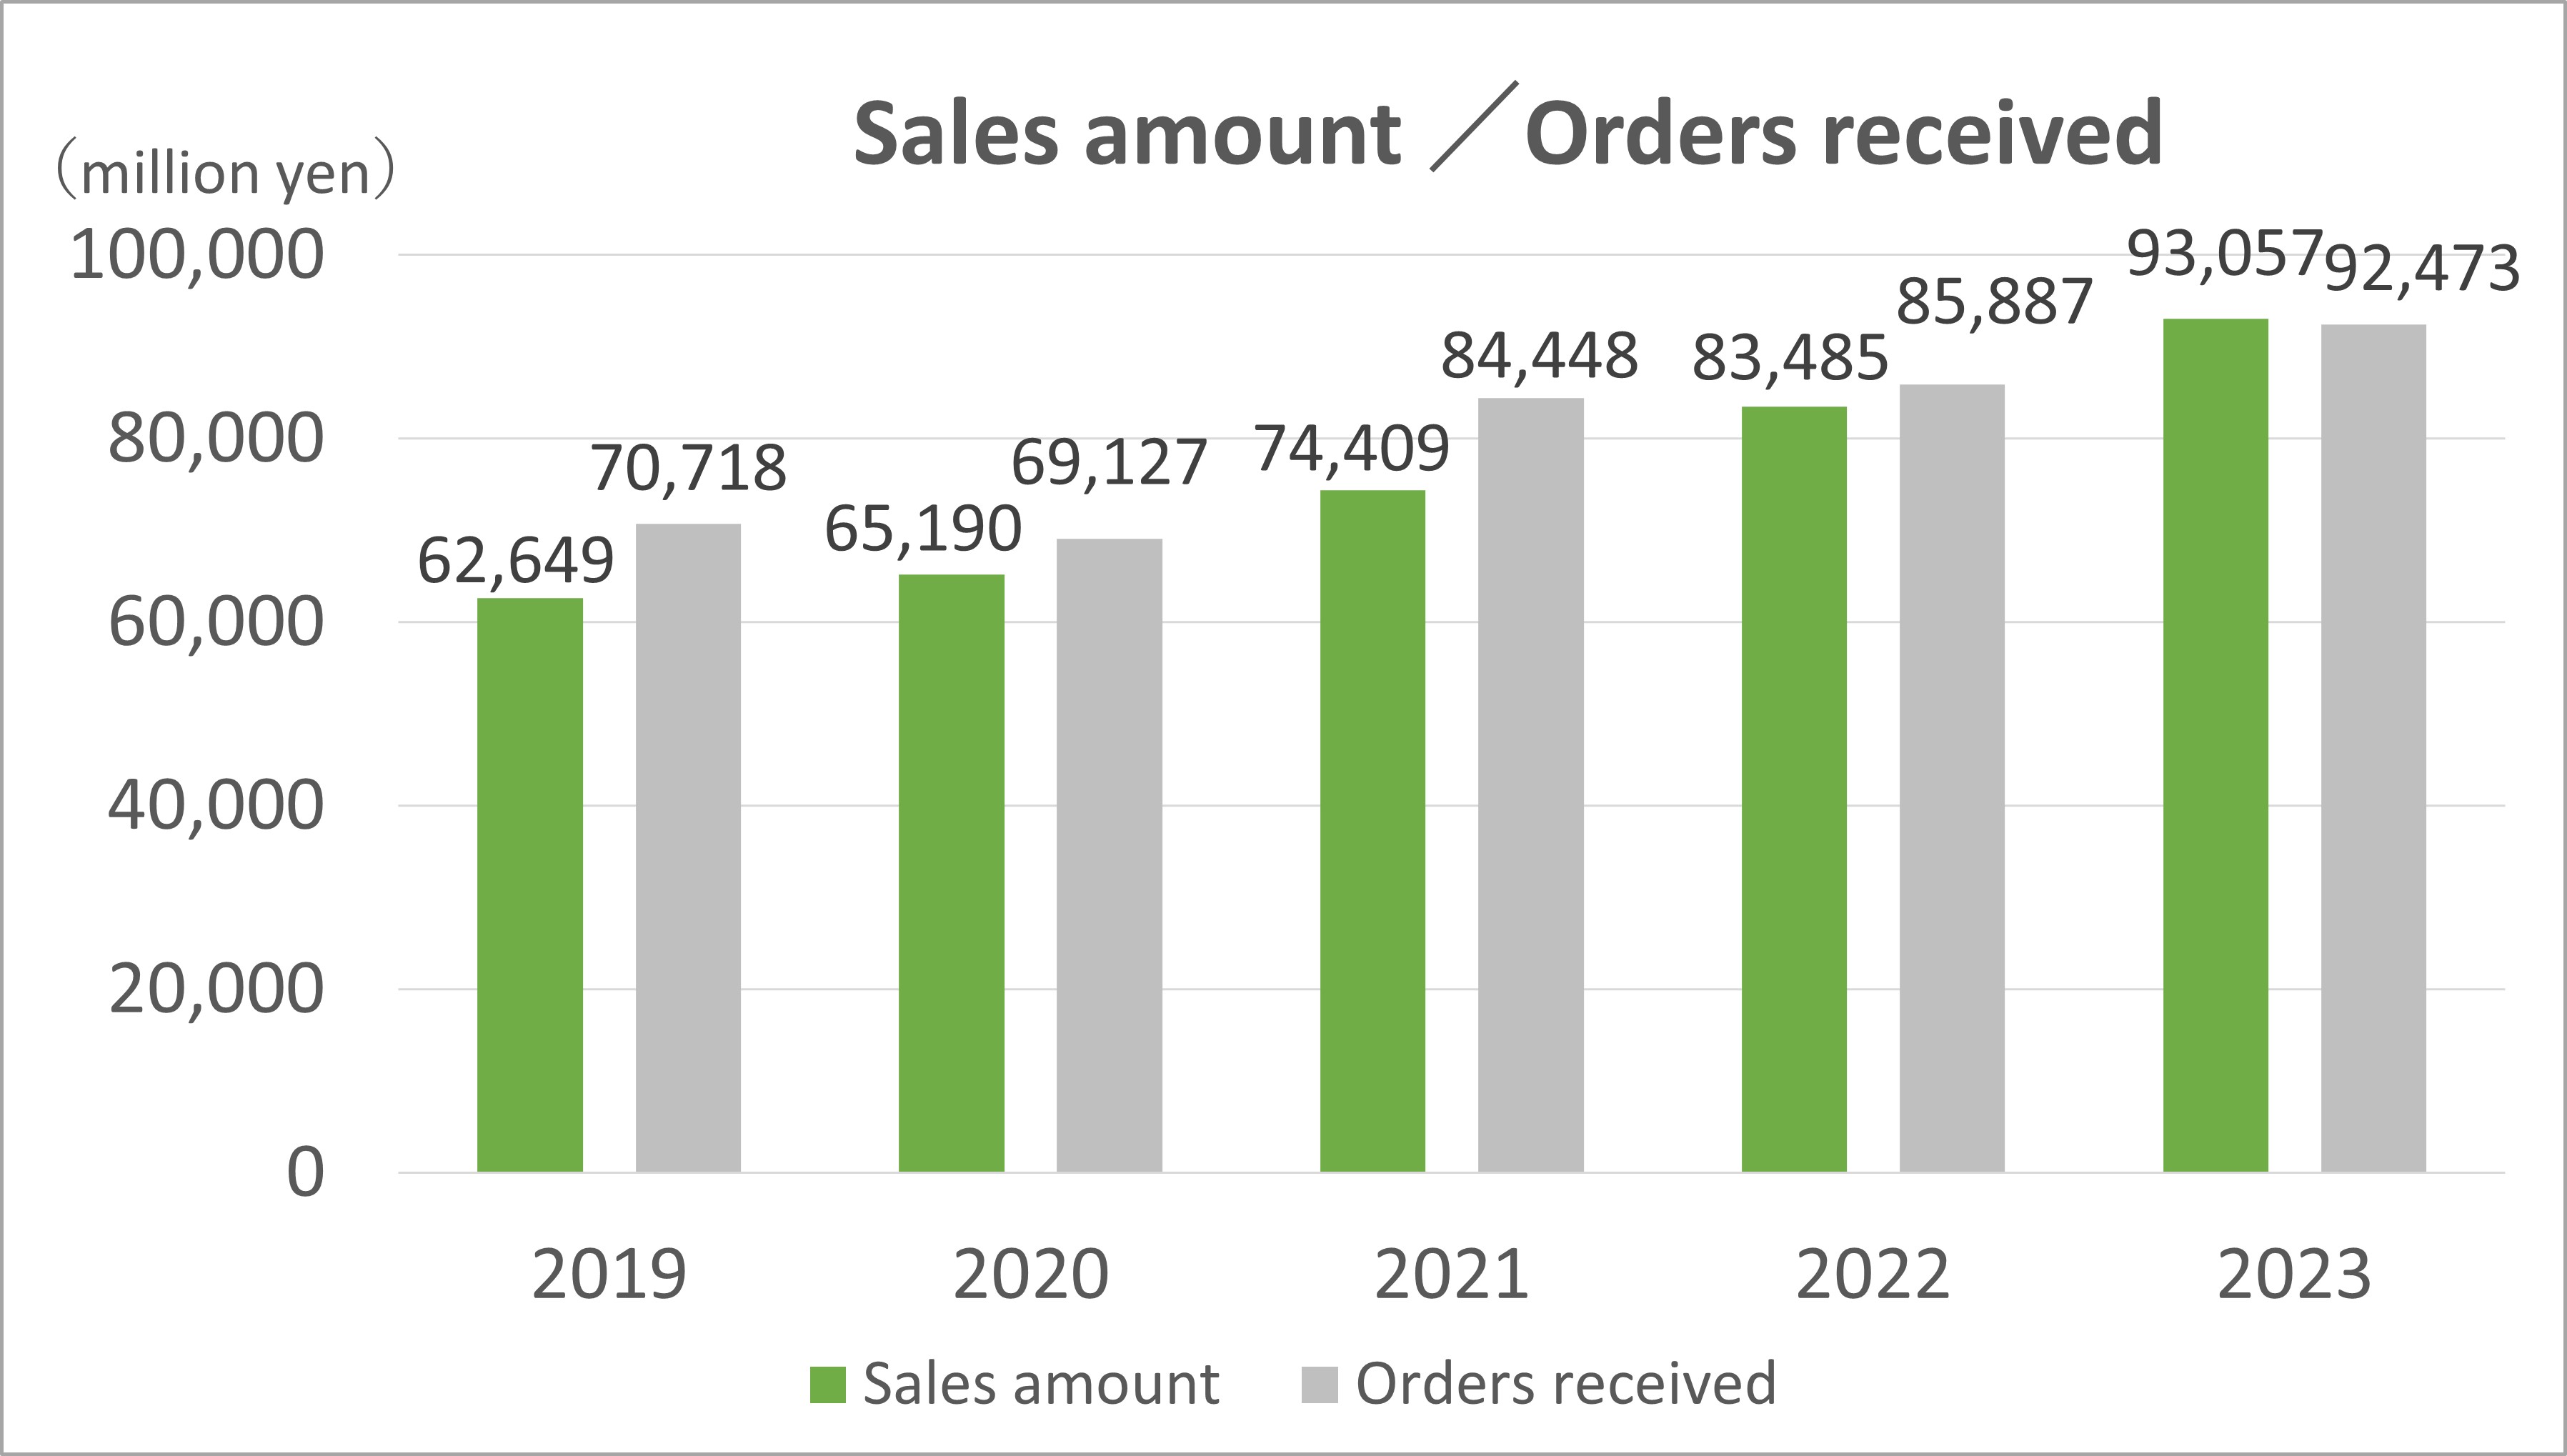
| Orders received(million yen) | 70,718 | 69,127 | 84,448 | 85,887 | 92,473 |
| Sales amount(million yen) | 62,649 | 65,190 | 74,409 | 83,485 | 93,057 |
| Operating income(million yen) | 4,267 | 5,085 | 6,991 | 8,017 | 10,011 |
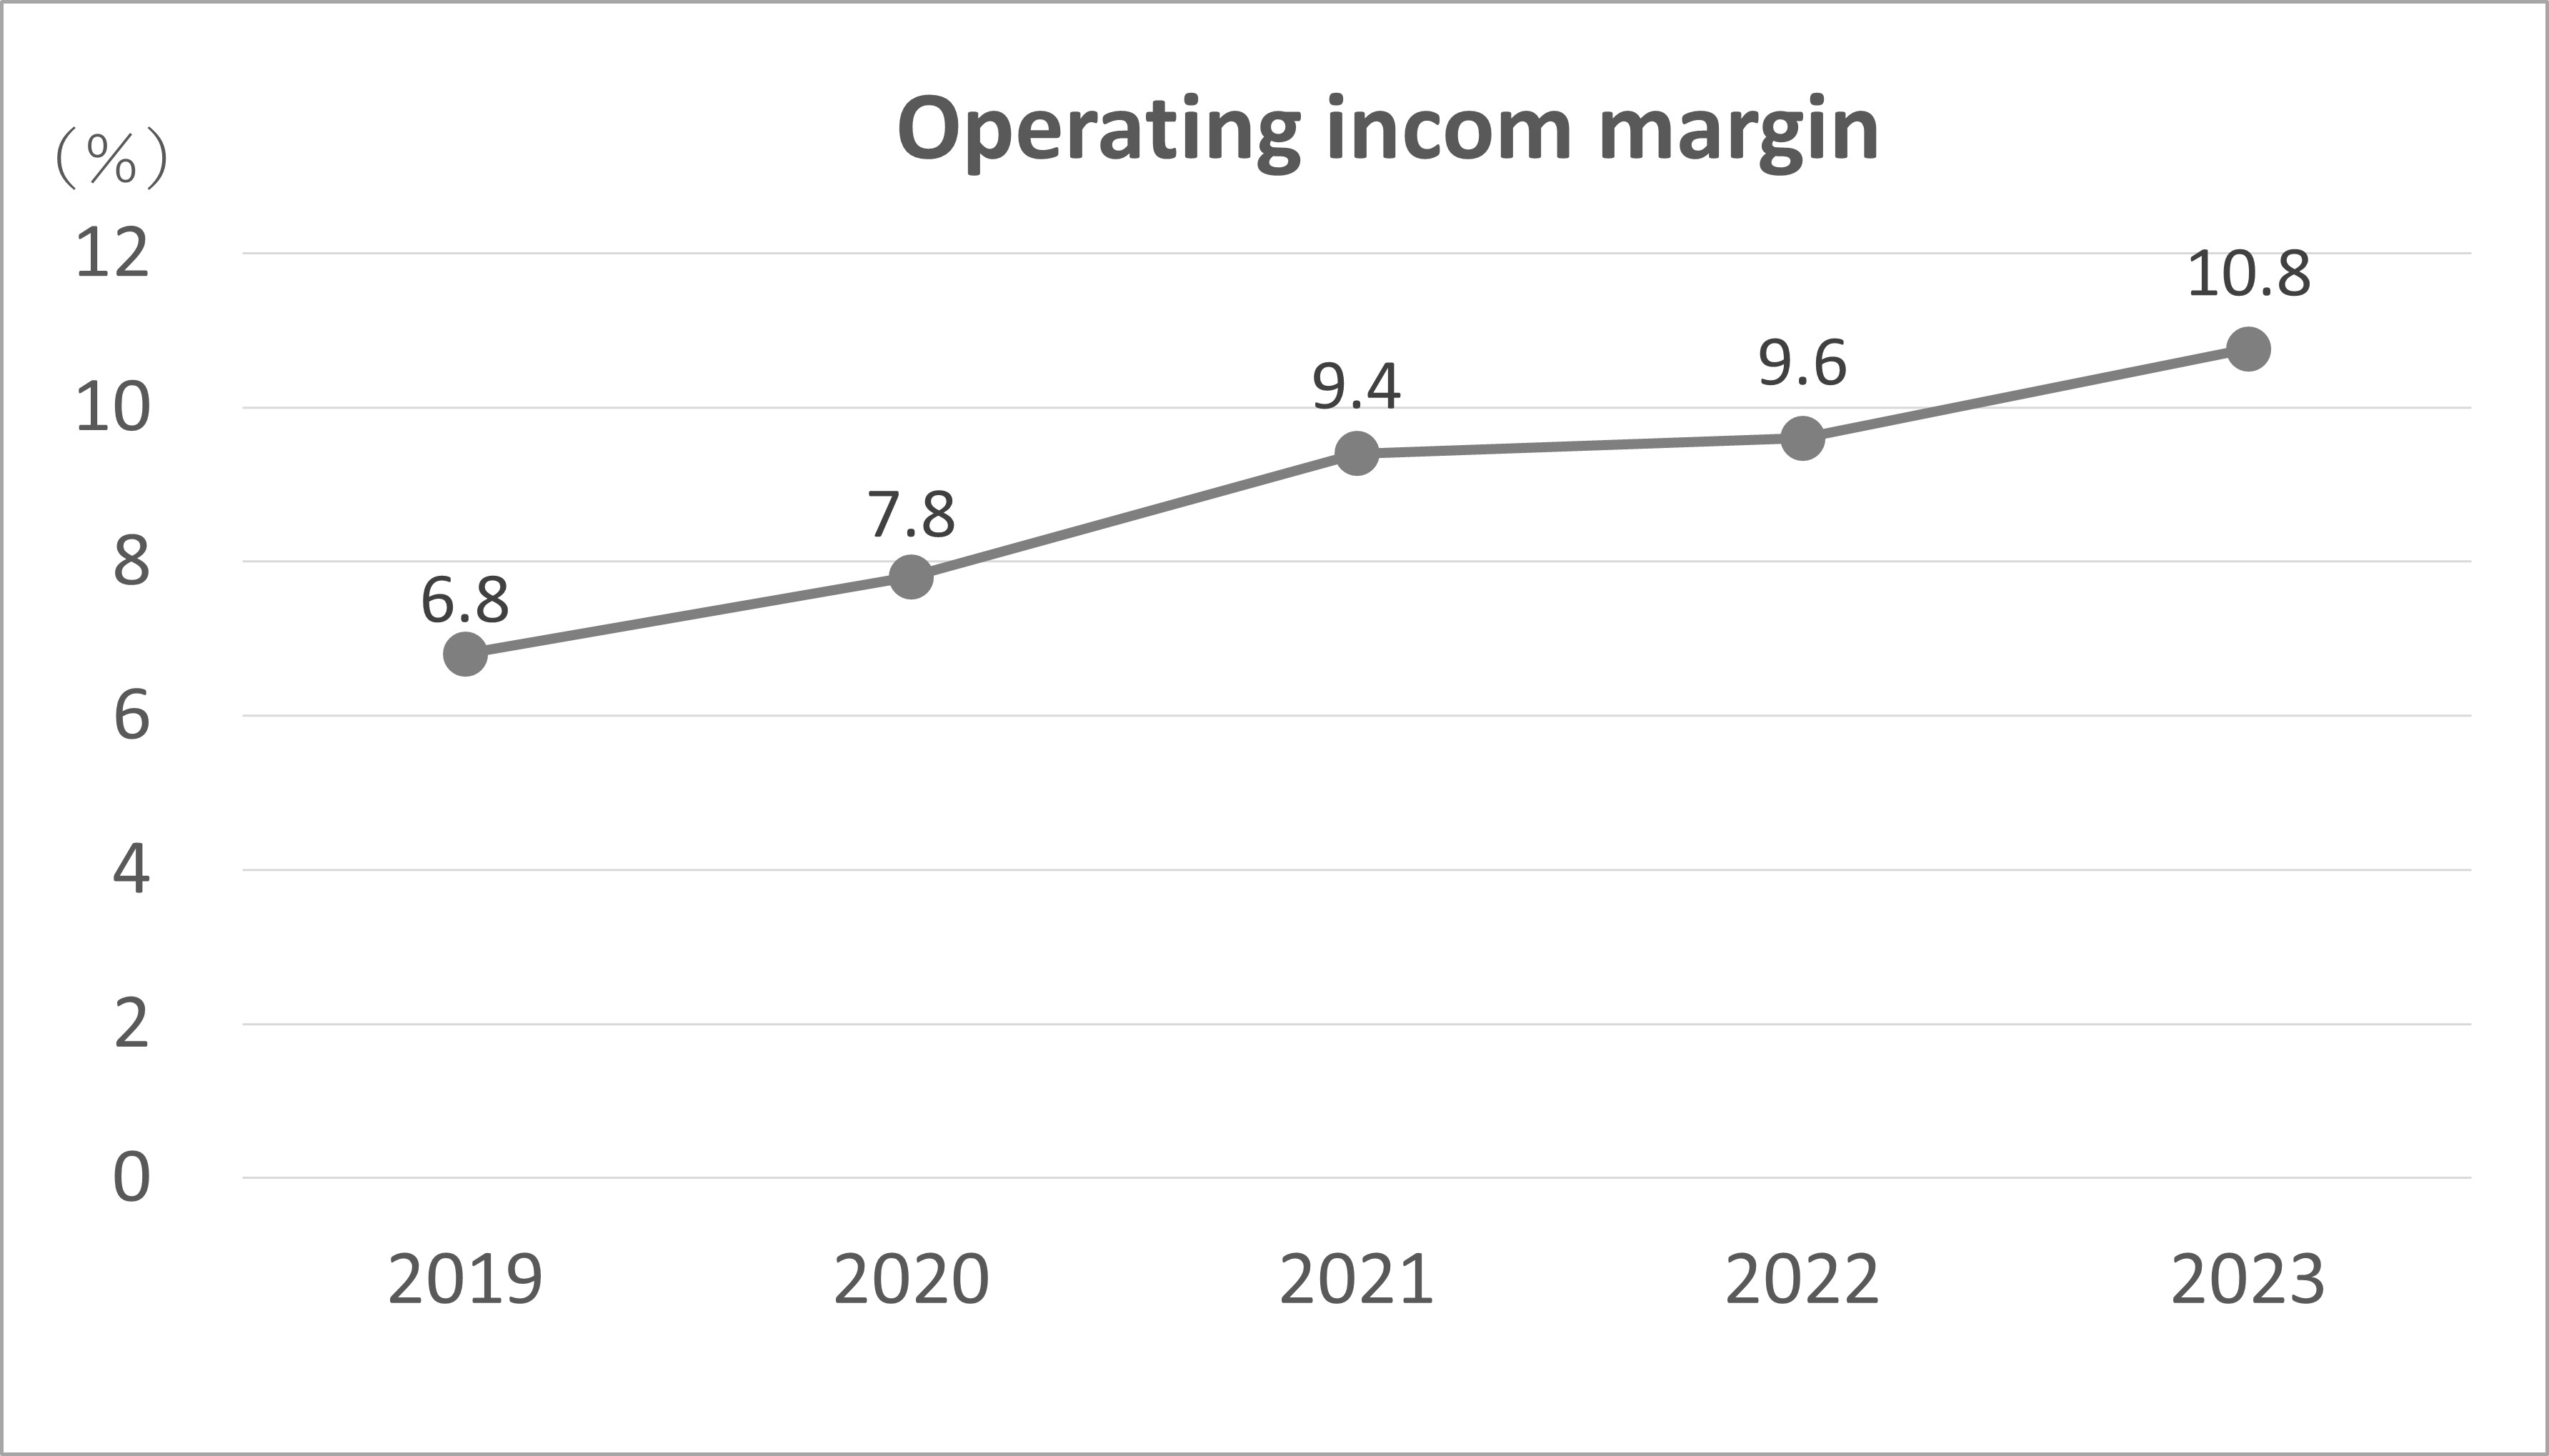
| Operating income Margin(%) | 6.8 | 7.8 | 9.4 | 9.6 | 10.8 |
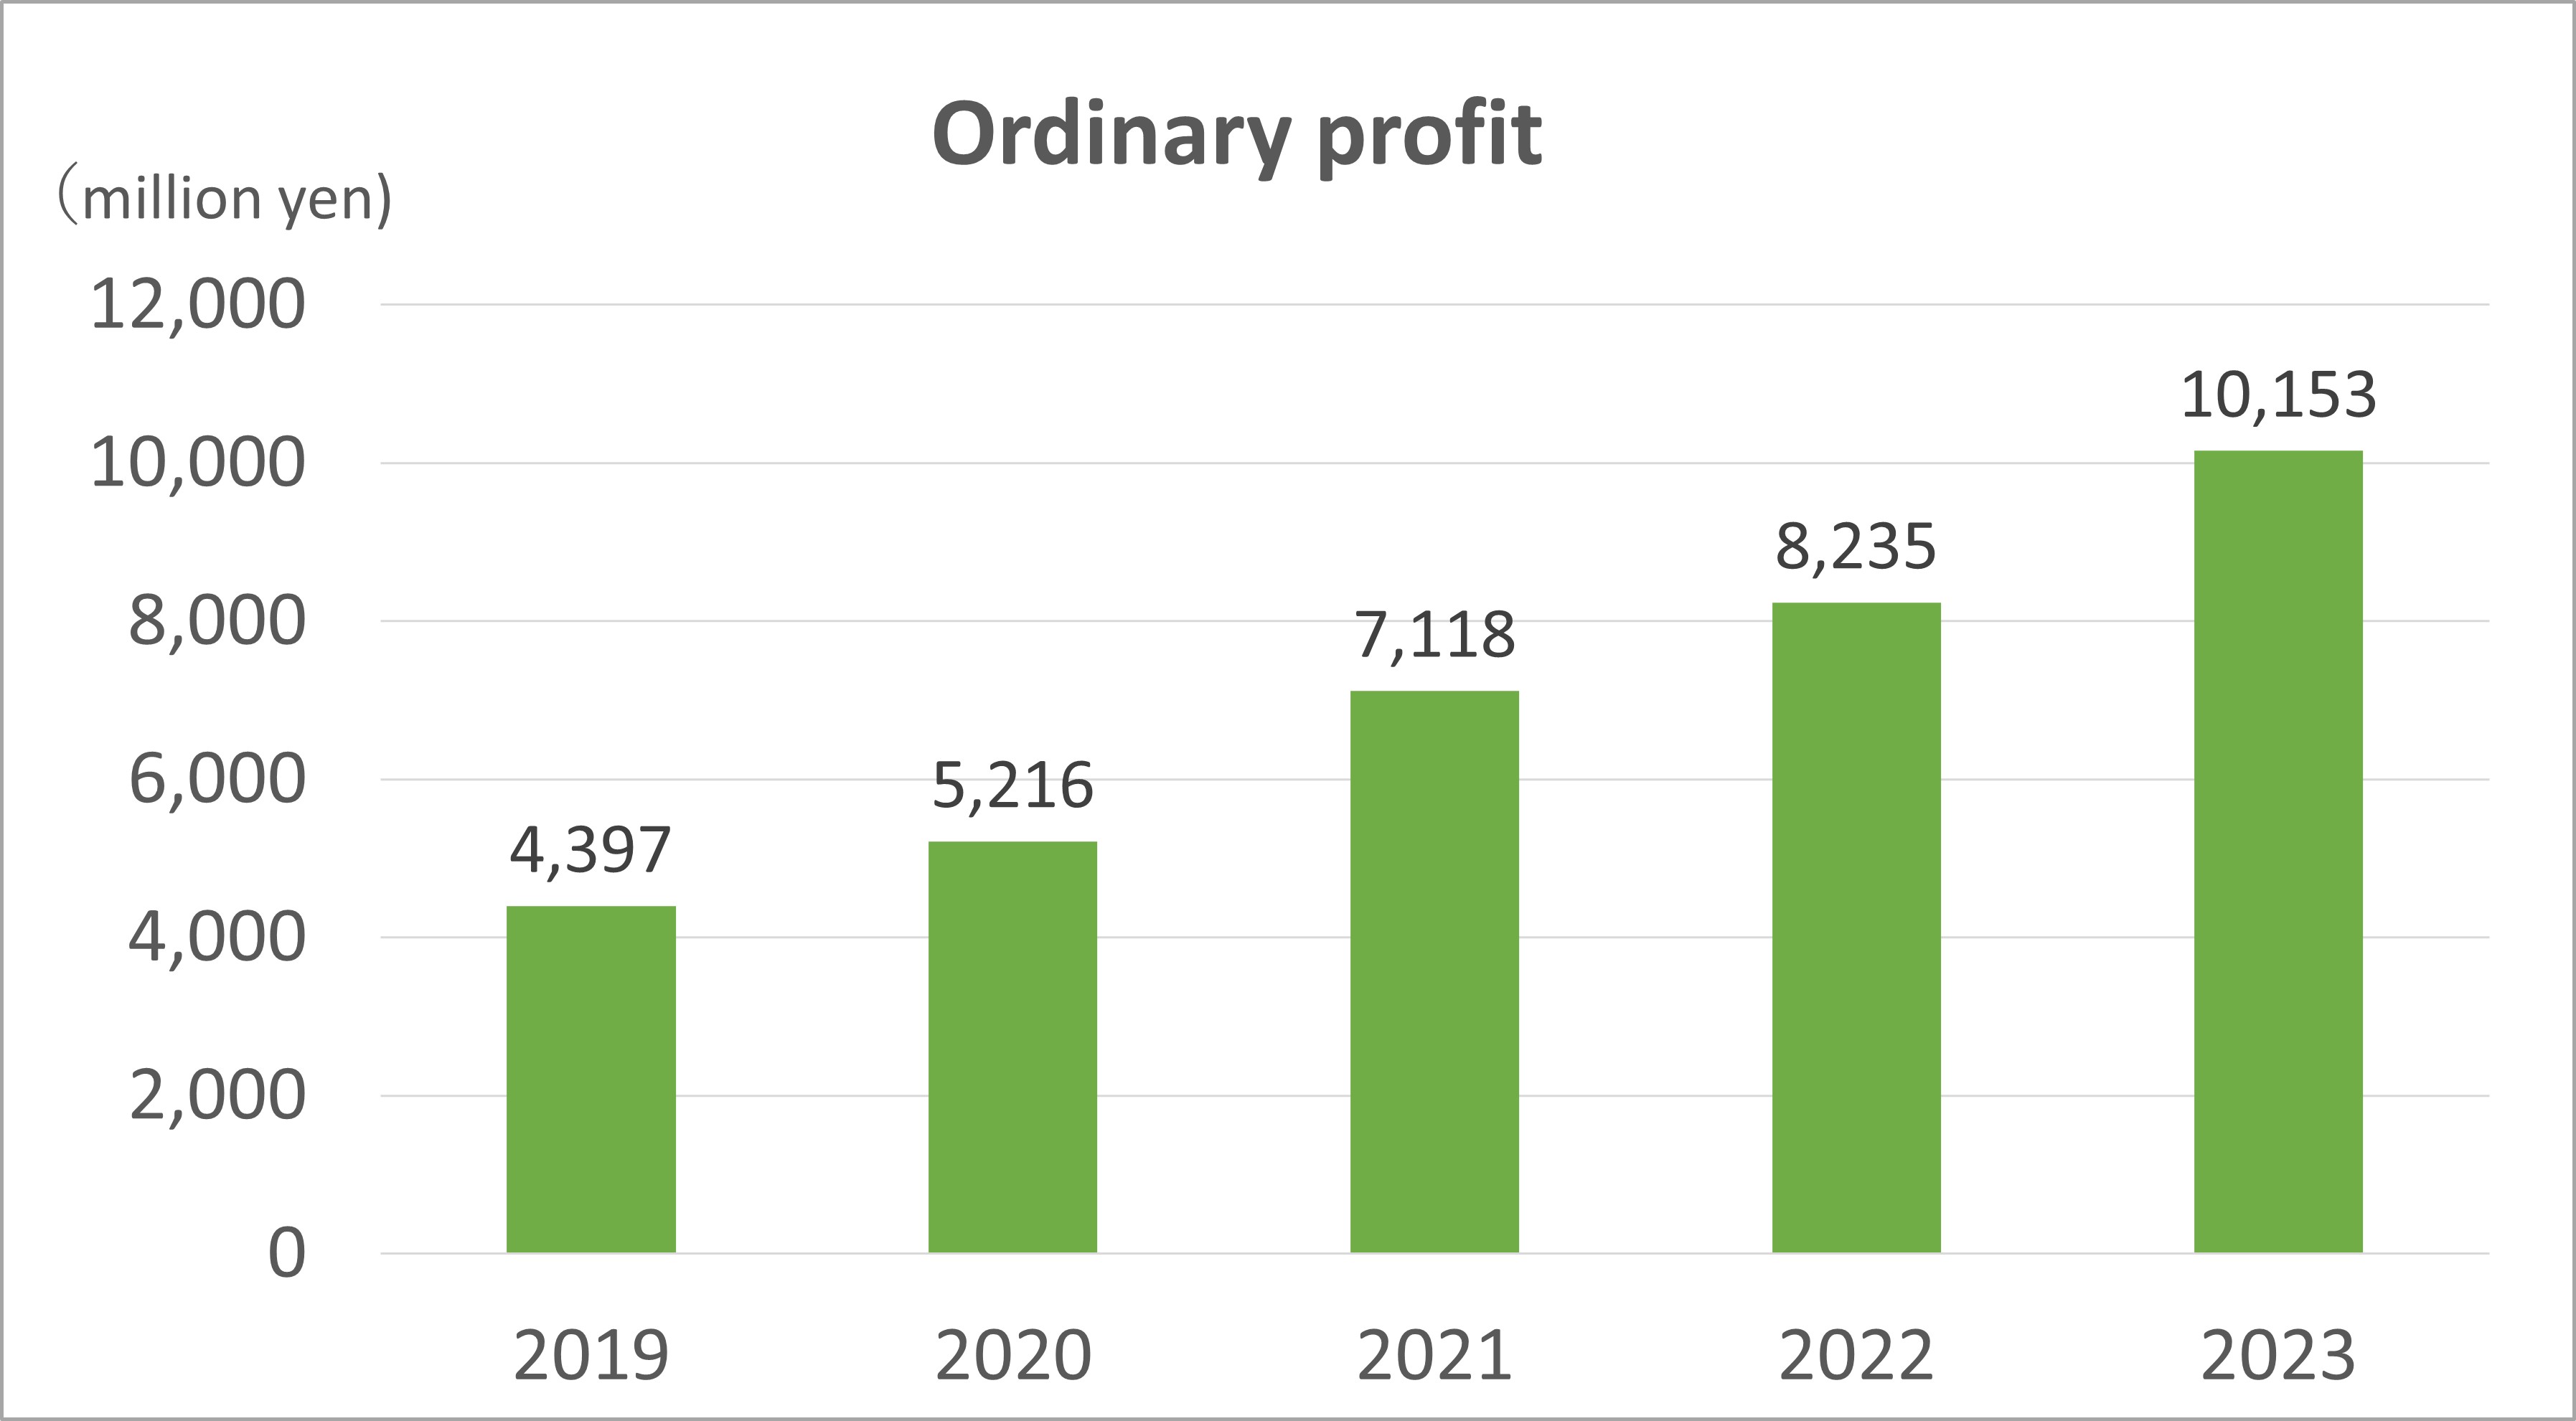
| Ordinary profit(million yen) | 4,397 | 5,216 | 7,118 | 8,235 | 10,153 |
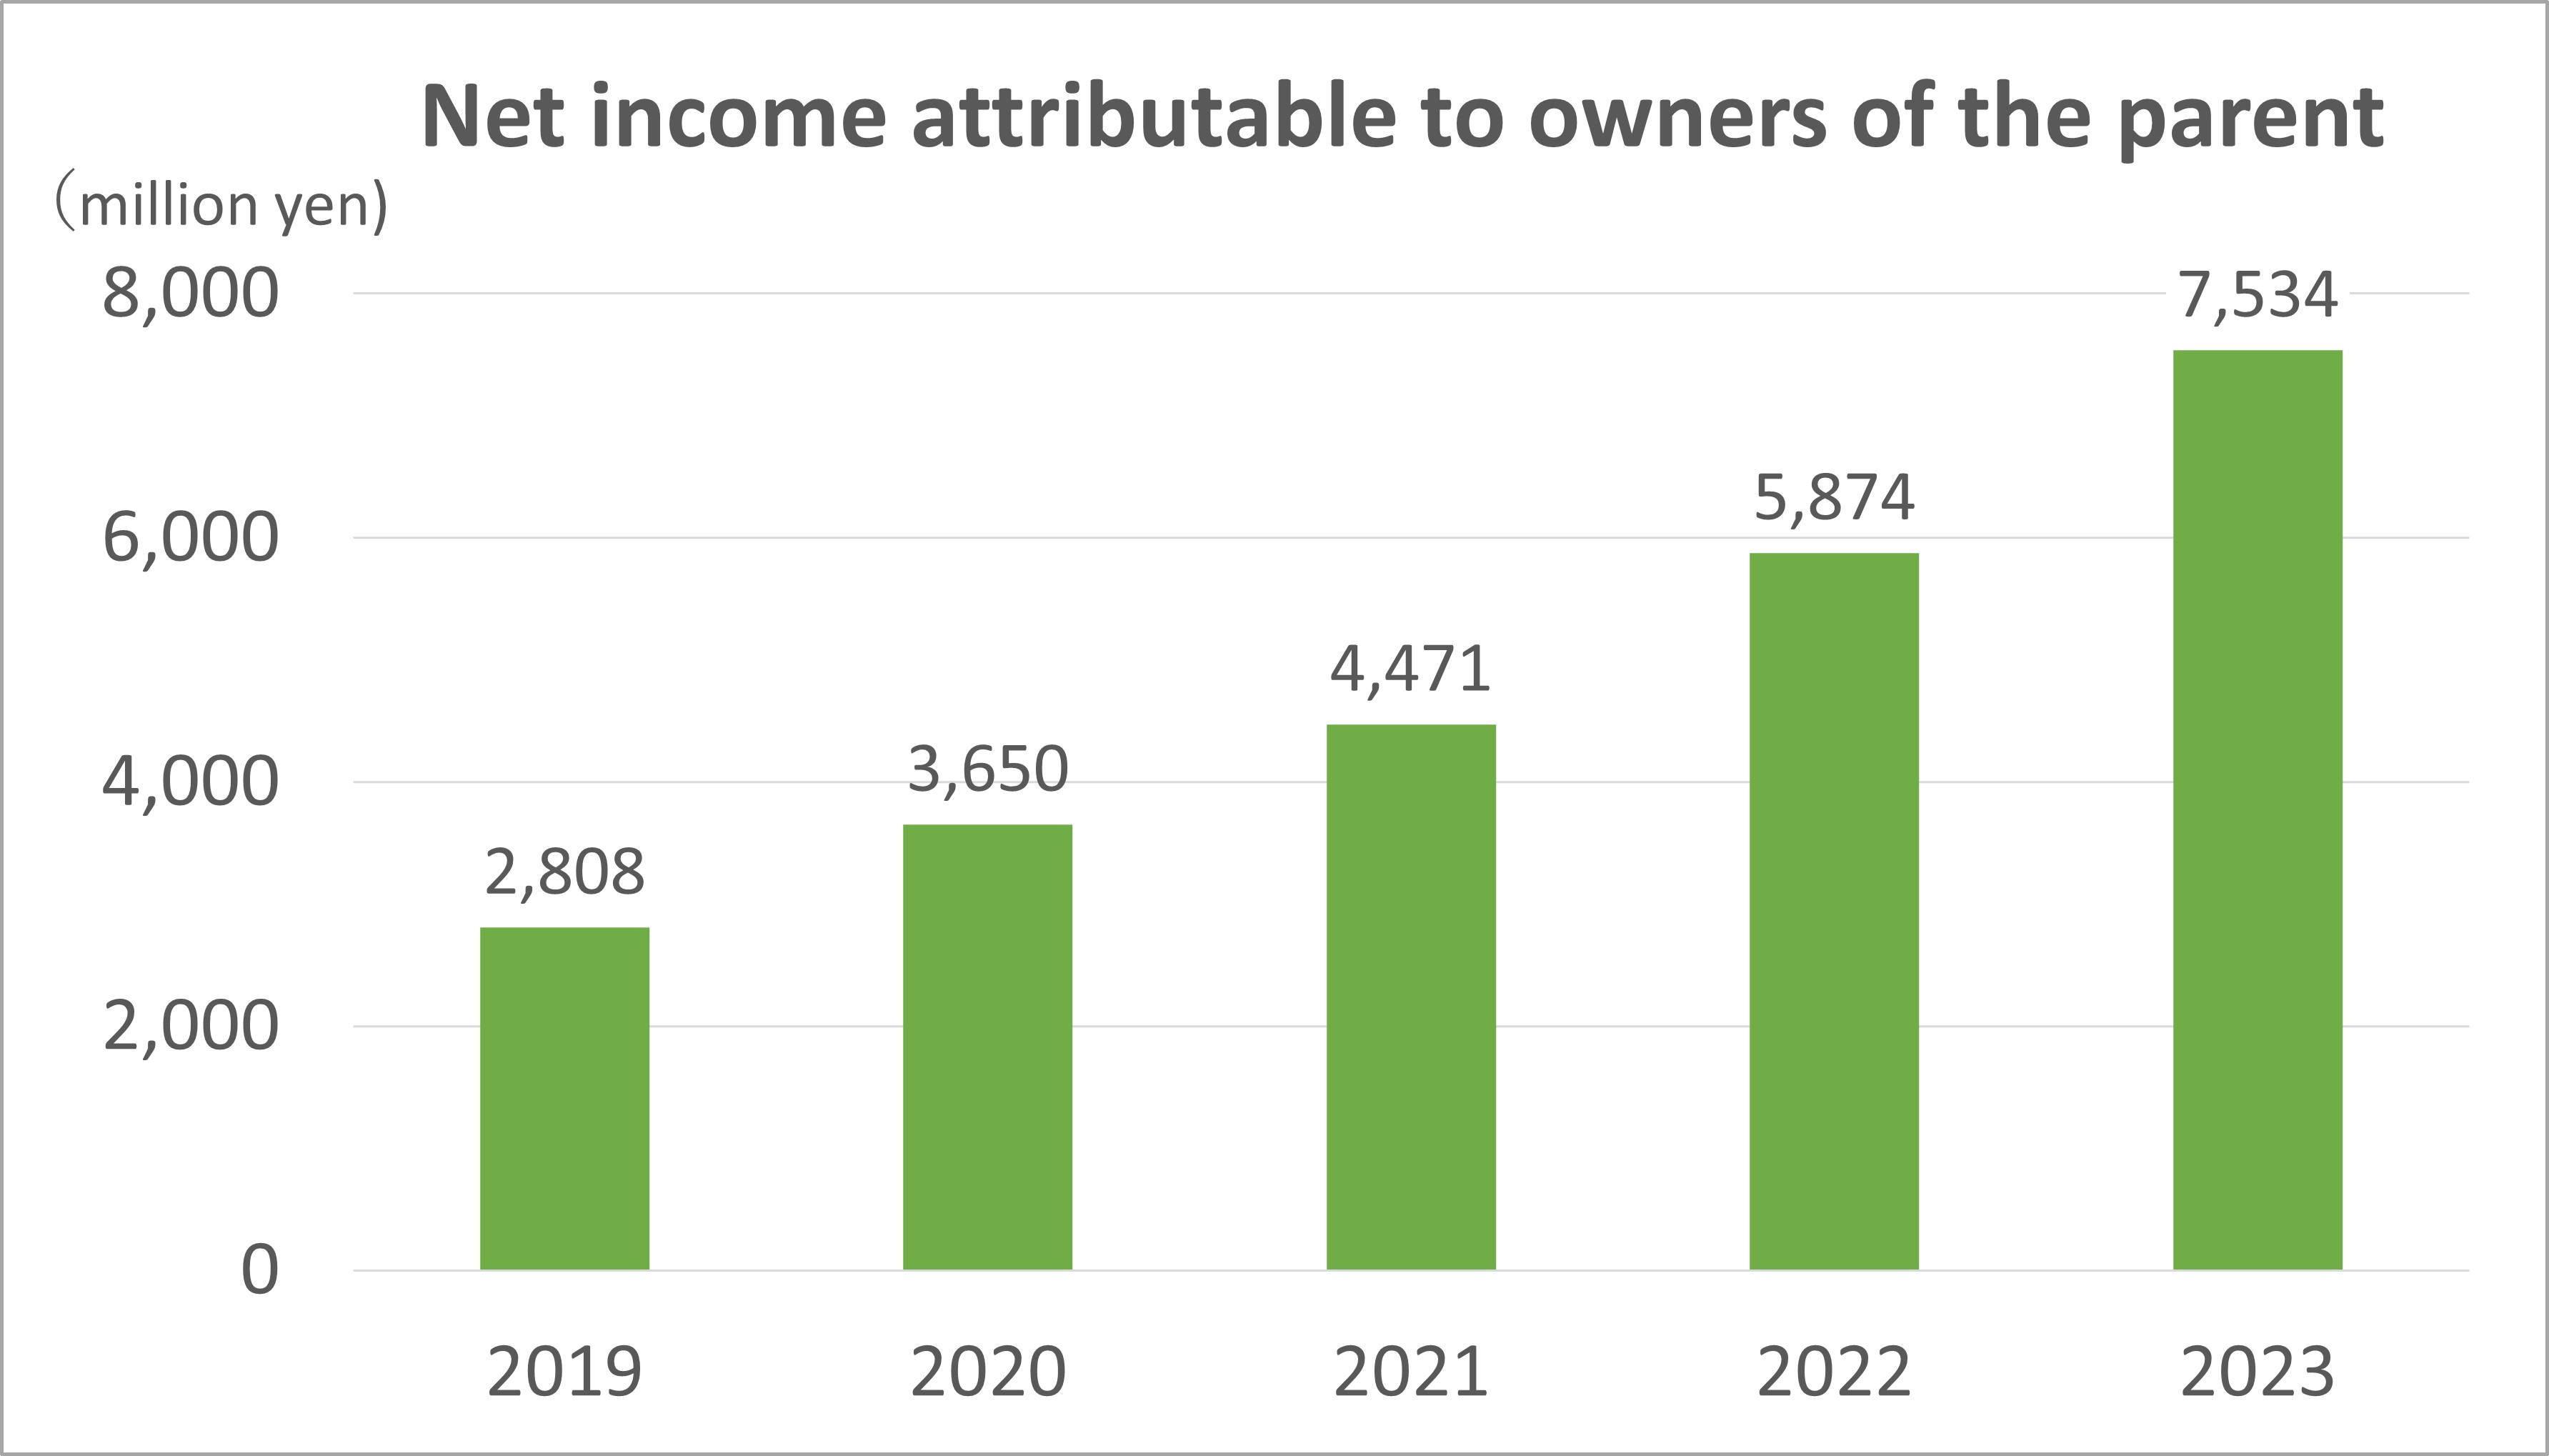
| Net income attributable to owners of the parent(million yen) | 2,808 | 3,650 | 4,471 | 5,874 | 7,534 |
| Comprehensive income(million yen) | 3,766 | 3,656 | 6,082 | 6,196 | 9,667 |
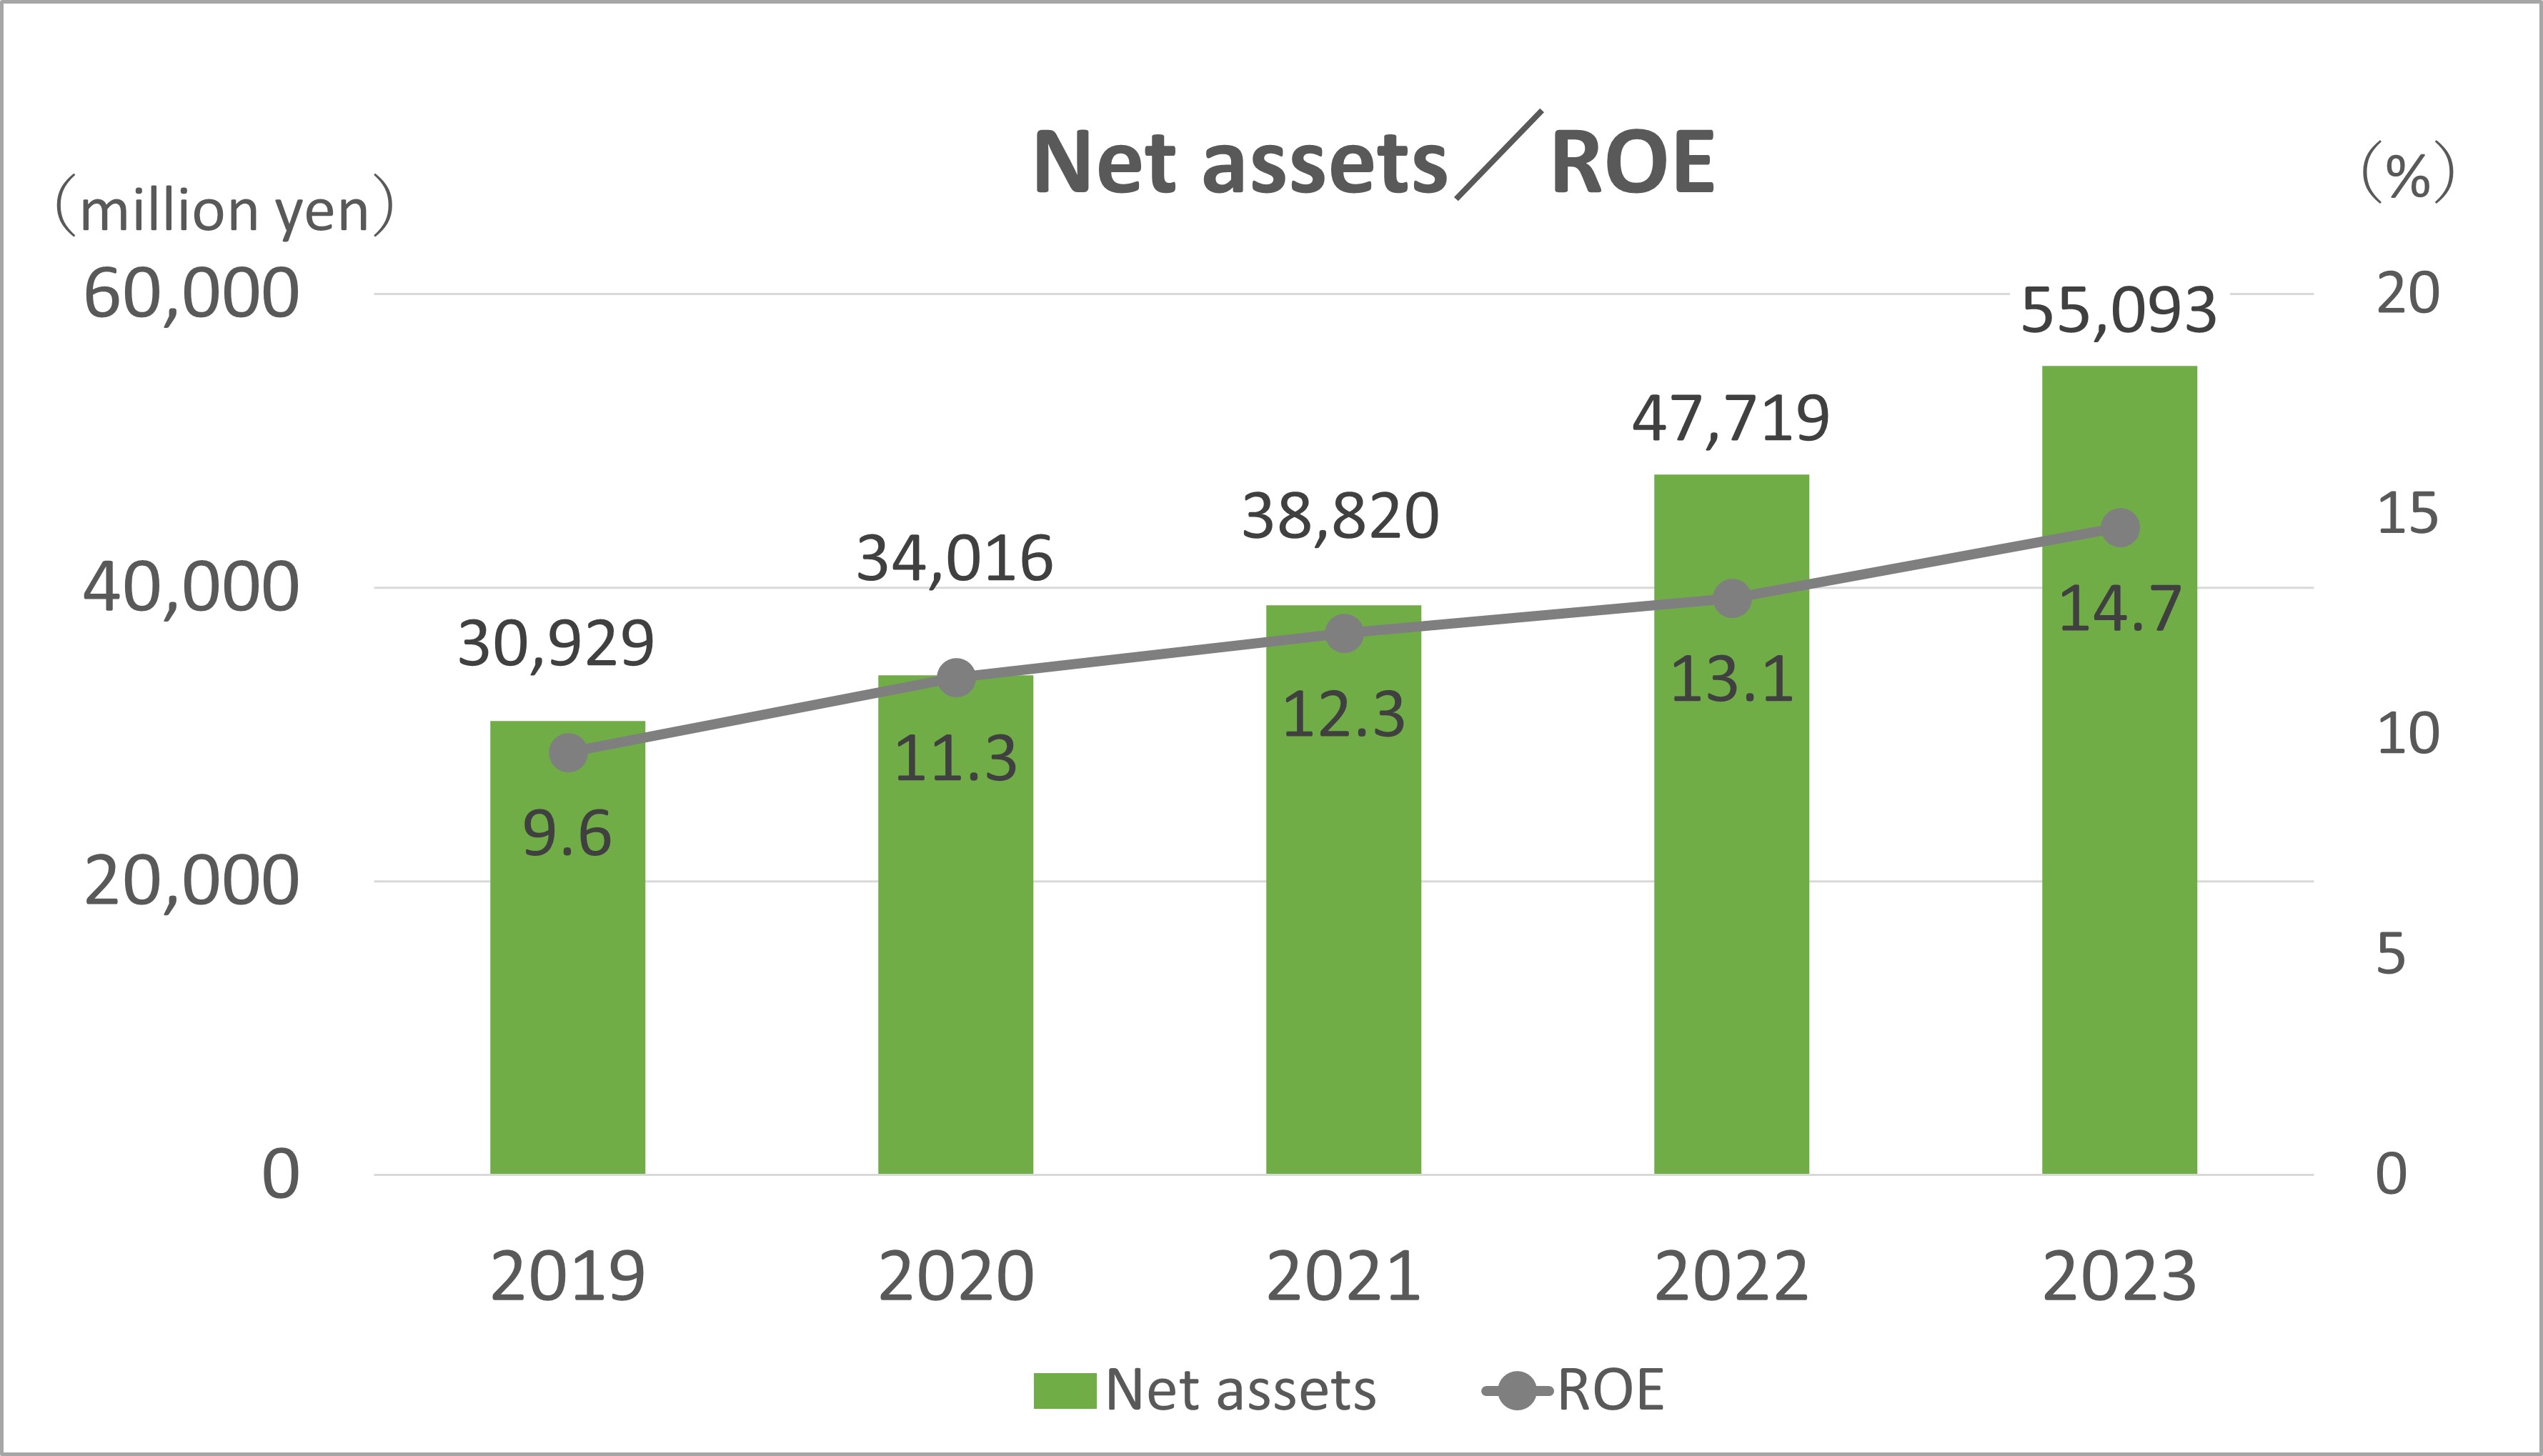
| Net assets(million yen) | 30,929 | 34,016 | 38,820 | 47,719 | 55,093 |
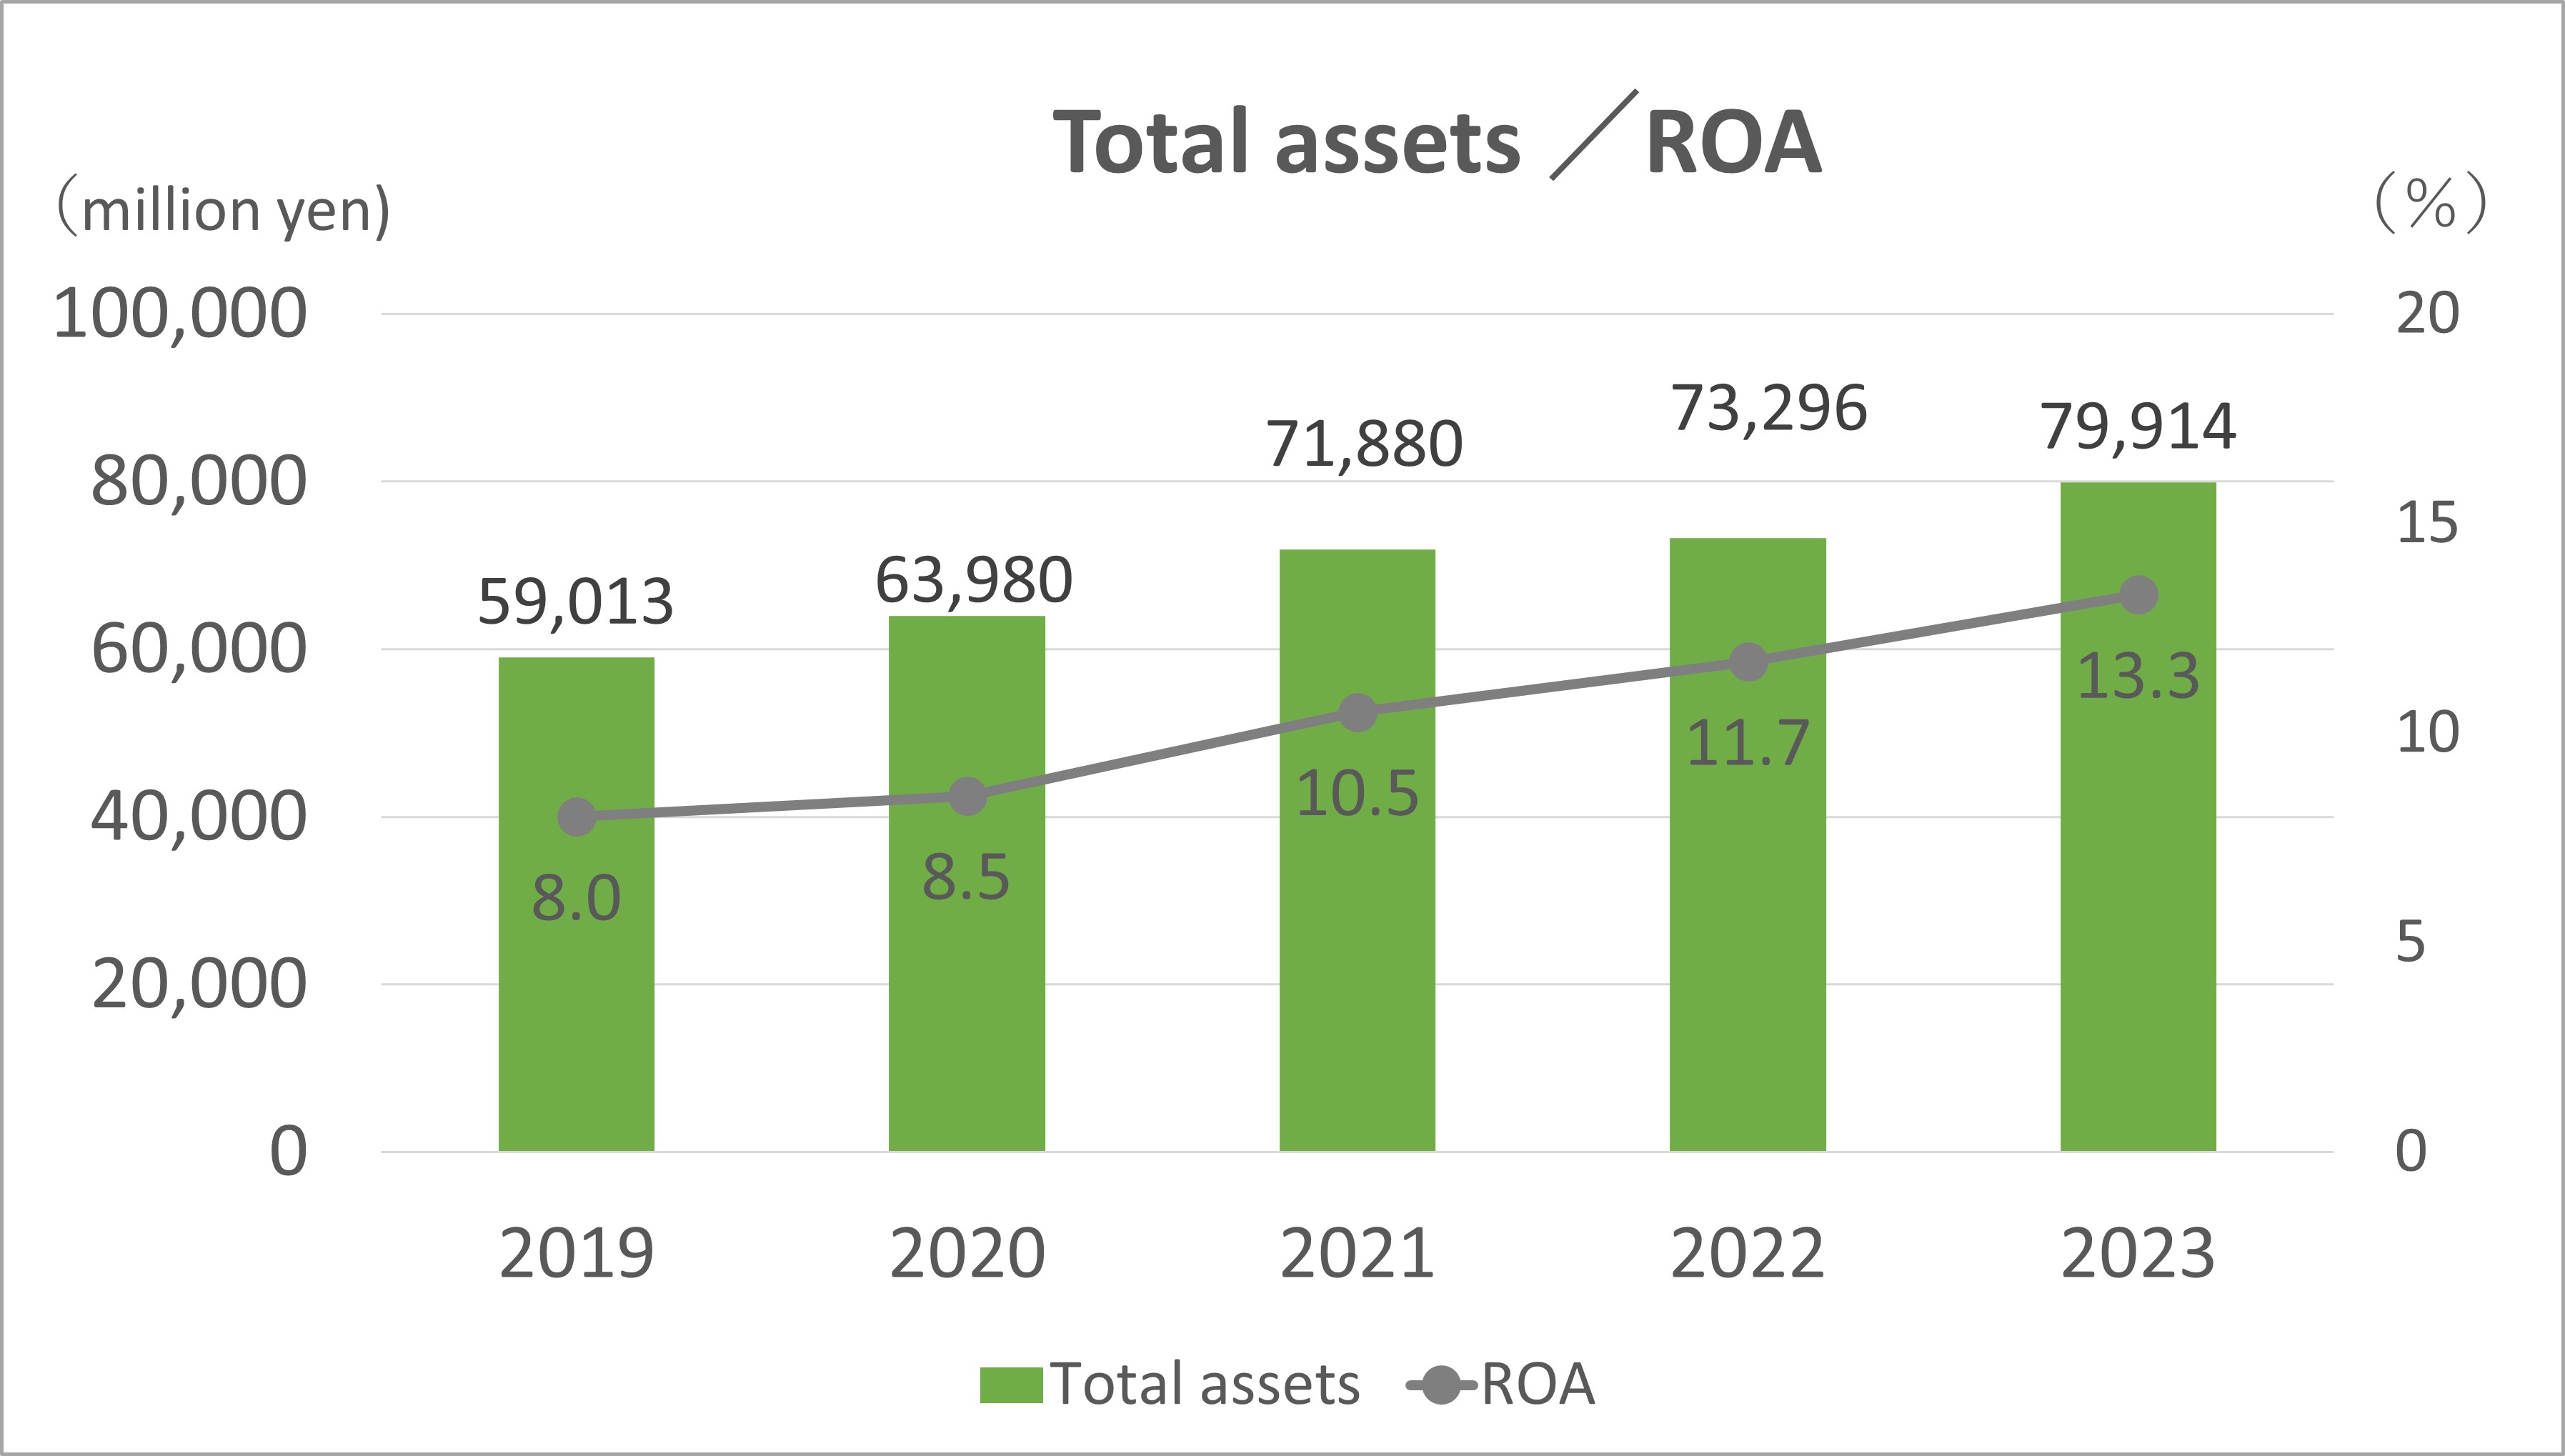
| Total assets(million yen) | 59,013 | 63,980 | 71,880 | 73,296 | 79,914 |
| Net assets per share(yen) | 2,169.53 | 2,393.36 | 2,734.99 | 3,360.83 | 3,958.89 |
| Net income per share(yen) | 198.59 | 258.17 | 316.25 | 415.49 | 542.13 |
| Net worth ratio(%) | 52.0 | 52.9 | 53.8 | 64.8 | 68.7 |
| ROE(Return on Equity)(%) | 9.6 | 11.3 | 12.3 | 13.1 | 14.7 |
| ROA(Return on Assets)(%) | 8.0 | 8.5 | 10.5 | 11.7 | 13.3 |